Simple math, uncomfortable answer
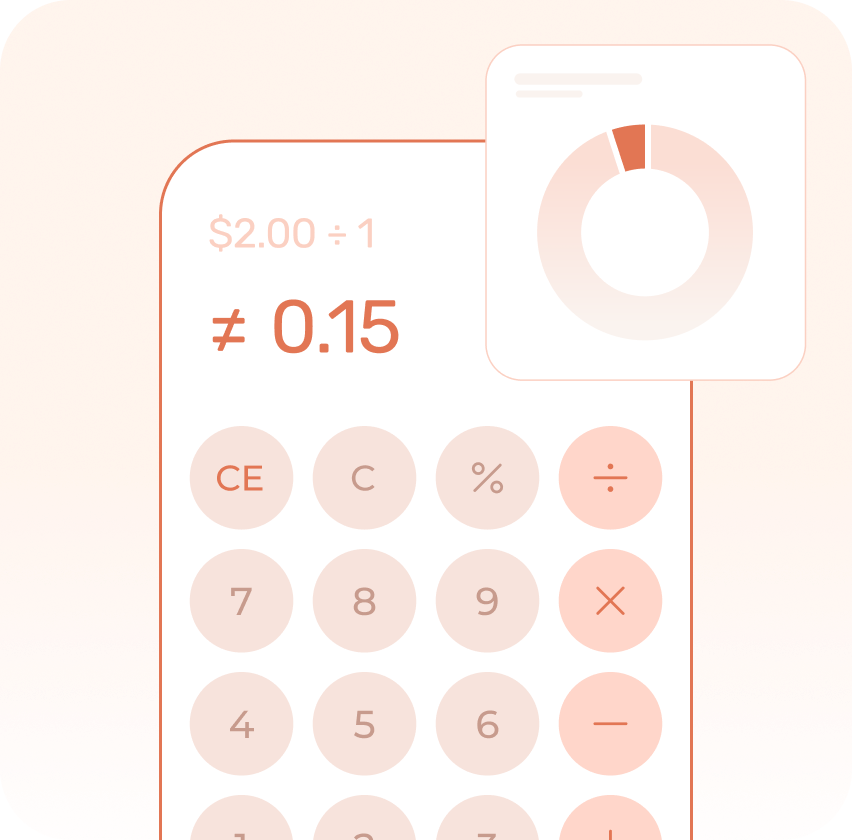
If CPM is $2 and IPM is 1, your install can't cost $0.15
Someone is selling you installs at $0.15. But showing an ad to 1,000 real people in your market costs $2+. Even with a best-in-class IPM of 1, the minimum real CPI is $2.00.
So where are those $0.15 installs coming from? Not from real impressions to real humans. The math simply doesn't allow it.
Interactive tool
UA Reality Check
Enter what you're being offered — per install (CPI) or per action (CPA). Pick your pricing model below; each check loads real market CPM benchmarks and shows instantly whether the math is even possible.
Static preview. This viewer doesn't run scripts, so the numbers below show a fixed example (United States × Android × Video × Fintech). Open the page in Safari or Chrome to use the live calculator.
Vertical
Country
Platform
Ad format
Market CPM (cost of real impressions)$25.75
Don't know your CPM? Leave it — it's pre-filled with the Reliz DSP median for your selection above.
CPI you're being offered$
Drag for quick estimates or type the exact CPI from your offer.
Realistic IPM for your vertical0.8
Don't know your IPM? Leave it — it's pre-filled with a realistic benchmark for your vertical. If unsure, keep it generous: a higher IPM makes the floor lower, so the check stays fair to the seller.
Monthly UA budget$10,000
Real CPM data from Reliz DSP United States × Android × Video × fintech. CPM $25.75, IPM 0.8. Median interstitial CPM (in-app video proxy). Adjust sliders to match your data.
The math
Market CPM
$25.75
Your IPM
0.8
Minimum honest CPI
$32.19
CPM $25.75 ÷ IPM 0.8 = floor
CPI you're paying
$0.50
Floor CPI: $32.19 (Android, Video, United States)
Gap
-$31.69
98% below floor
Impact on your budget
Installs reported
20,000
Installs math allows
311
Ghost installs
19,689
98% of reported installs
Money spent on ghosts
$9,845
⚠ CPI is below floor price
United States Android Video: min CPI $32.19. Yours $0.50 — 98% below.
Floor: $32.19 | Yours: $0.50 (98% below)
Vertical
Country
Platform
Ad format
Market CPM (cost of real impressions)$25.75
Don't know your CPM? Leave it — it's pre-filled with the Reliz DSP median for your selection above.
Realistic IPM for your vertical0.8
Don't know your IPM? Leave it — it's pre-filled with a realistic benchmark for your vertical. If unsure, keep it generous: a higher IPM makes the floor lower, so the check stays fair to the seller.
CPA you're being offered$
Drag for quick estimates or type the exact CPA from your offer.
CR: install → target event8%
Pre-filled with a typical rate for your vertical's target event (e.g. registration, first deposit). Use your funnel's real CR if you know it.
Monthly UA budget$10,000
Real CPM data from Reliz DSP United States × Android × Video × fintech. CPM $25.75, IPM 0.8, CR 8% registration. Median interstitial CPM (in-app video proxy). Adjust sliders to match your data.
The math
Market CPM
$25.75
Your IPM
0.8
Minimum honest CPI
$32.19
CPM $25.75 ÷ IPM 0.8 = floor
CPA vs floor
CPA you're paying
$5.00
Implied CPI from CPA
$0.40
CPA $5.00 × CR 8%
Minimum honest CPA
$402.34
$32.19 ÷ 8% = floor CPA
CPA gap
-$397.34
99% below CPA floor
Impact on your budget
Events reported
2,000
Events math allows
25
Ghost events
1,975
99% of reported events
Money spent on ghosts
$9,875
⚠ CPA is below floor price
United States Android Video: min CPA $402.34 ($32.19 ÷ 8%). Yours $5.00 — 99% below. The implied CPI of $0.40 can't buy a real impression.
Floor: $402.34 | Yours: $5.00 (99% below)